I posted blog about calculation of Quadratic Entropy (QE) before.
Today, I will calculate and compare the diversity indices, Quadratic Entropy (QE), Shannon Entropy & Simpson index.
these diversity indices were used to evaluate tumor cell diversity. Evaluating tumor heterogeneity in immunohistochemistry-stained breast cancer tissue | Laboratory Investigation

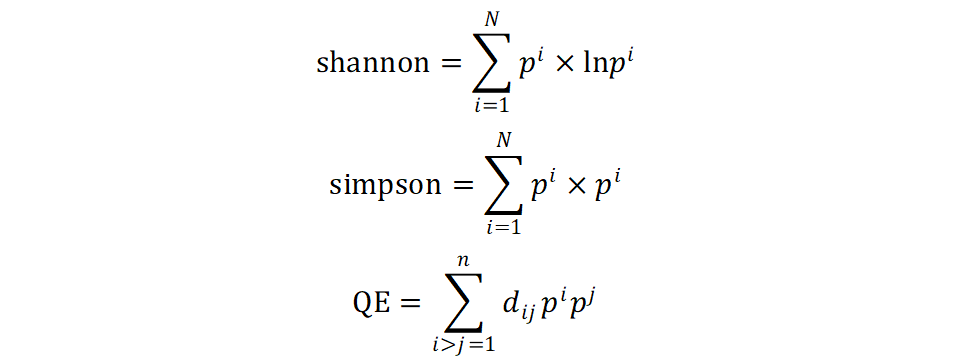
I calculate Quadratic Entropy (QE), Shannon Entropy & Simpson index for the same as the previous post.
library(ggplot2)

min <- 0
max <- 20

hist1 <- rnorm(500,10,1)
hist2 <- rnorm(500,10,1)
hist <- c(hist1, hist2)
data <- data.frame(intensity = hist)
head(data)

len <- length(data$intensity)
K <- 1 + log2(len)

plt <- ggplot(data,aes(x=intensity))+
  geom_histogram(bins=round(K))

plt

add <- max/K

break_data <- seq(min, max, add)
break_data <- c(break_data, break_data[length(break_data)]+add)
data$bins <- cut(data$intensity, breaks=break_data,label=FALSE)

data <- na.omit(data)
hist_data <- data.frame(table(data$bins))

result <- data.frame(Num = seq(1:length(break_data)))
result <- merge(result,hist_data,by.x="Num", by.y ="Var1",all=T)
result[is.na(result)] <- 0

result$"Freq" <- result$"Freq"/sum(result$"Freq")
result$"Num" <- (result$"Num"-min(result$"Num"))/(max(result$"Num")-min(result$"Num"))

distance <-  dist(result$"Num",method = "euclidean")

D <- as.matrix(distance)
p <- as.vector(result$"Freq")

#Calculate Quadratic Entropy
QE <- c(crossprod(p, D %*% p)) / 2
QE

#Calculate Shannon Entropy
shanon <- -sum(result$"Freq"*log2(result$"Freq"+1e-15) )
shanon

#Calculate Simpson idex
simp <- sum(result$"Freq"*result$"Freq" )
simp
I tested multiple histogram which changed rnorm mean values and number of datasets.
The following data is the calculation result of QE, Shannon entropy and Simpson index.
The 50 : 50 mix consists of 2 units normal distribution, and the mean of the distribution is changed as follows:

These data showed that the value of QE are increased when distribution of histogram were separated.
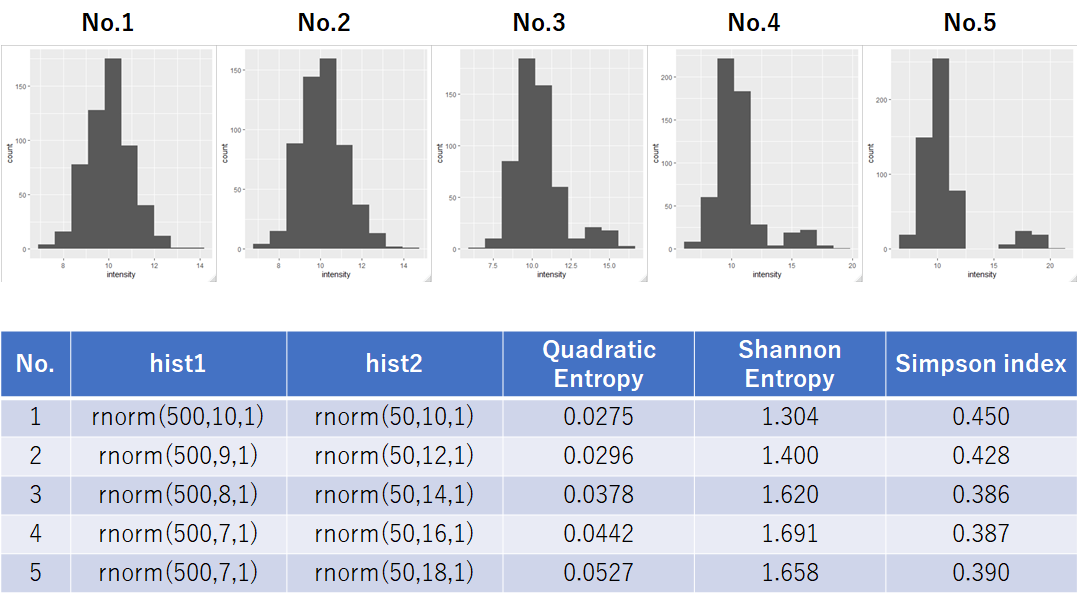
Next, the following data is the calculation result of different 10∶1 mix which consists of 2 unit normal distributions.

Shannon entropy and Simpson index are not sensitive to a small 10% subpopulation. On the other hand, it is shown that the value of QE increased steadily.
These data showed that Quadratic entropy is better at detecting small distribution differences than Shannon entropy and Simpson index.