High Content Analysis (HCA) is one of the powerful tools for the drug discovery.
High-content screening (HCS), also known as high-content analysis (HCA) or cellomics, is a method that is used in biological research and drug discovery to identify substances such as small molecules, peptides, or RNAi that alter the phenotype of a cell in a desired manner.
High-content screening - Wikipedia
HCA can detect the single cell phenotype and measure many phenotype information (target intensity, size&shape, and texture) , however, in most cases, single-cell data is averaged per well to simplify analysis.
Advanced Assay Development Guidelines for Image-Based High Content Screening and Analysis - Assay Guidance Manual - NCBI Bookshelf
Some researchers tried to detect cell-cell heterogeneity in high content analysis.
Identifying and Quantifying Heterogeneity in High Content Analysis: Application of Heterogeneity Indices to Drug Discovery
Biologically Relevant Heterogeneity: Metrics and Practical Insights
Rao's Quadratic Entropy (QE) were used as index of cellular diversity in this paper.
Rao's quadratic entropy is a measure of diversity of ecological communities defined by Rao (1982)
https://rdrr.io/cran/SYNCSA/man/rao.diversity.html
https://www.sciencedirect.com/science/article/pii/0040580982900041

They evaluated potential indices of Diversity and showed that QE (Quadratic entropy) increase steadily with two different sample histogram distribution.
https://doi.org/10.1371/journal.pone.0102678.s007
I 'm very interesting to calculate Quadratic Entropy, so I calculate QE of model distributions by using R.
library(ggplot2)

min <- 0
max <- 20

hist1 <- rnorm(500,10,1)
hist2 <- rnorm(500,10,1)
hist <- c(hist1, hist2)
data <- data.frame(intensity = hist)

#Calculate number of bins
len <- length(data$intensity)
K <- 1 + log2(len)

plt <- ggplot(data,aes(x=intensity))+
  geom_histogram(bins=round(K))

plt

#Cut the data to each bin based on the braks
add <- max/K
break_data <- seq(min, max, add)
break_data <- c(break_data, break_data[length(break_data)]+add)
data$bins <- cut(data$intensity, breaks=break_data,label=FALSE)

data <- na.omit(data)
hist_data <- data.frame(table(data$bins))

result <- data.frame(Num = seq(1:length(break_data)))
#Merge result and hist_data by left outer join
result <- merge(result,hist_data,by.x="Num", by.y ="Var1",all=T)
result[is.na(result)] <- 0

#Calculate Frequency
result$"Freq" <- result$"Freq"/sum(result$"Freq")
#Normalized Number
result$"Num" <- (result$"Num"-min(result$"Num"))/(max(result$"Num")-min(result$"Num"))

#Calculate distance
distance <-  dist(result$"Num",method = "euclidean")

D <- as.matrix(distance)
p <- as.vector(result$"Freq")

#Calculate Quadratic Entropy
QE <- c(crossprod(p, D %*% p)) / 2
QE
I wrote the code referring to the link below.
Error - Cookies Turned Off
Identifying and Quantifying Heterogeneity in High Content Analysis: Application of Heterogeneity Indices to Drug Discovery
r - Calculate Rao's quadratic entropy - Stack Overflow
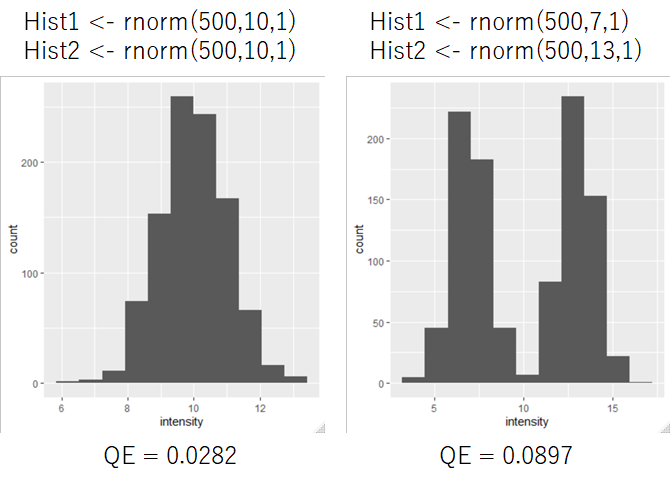
I show the data below that calculate QE of two different distributions.

QE are increased when distribution of histogram were changed.
The mean of two different histograms is the same, so the difference between them cannot be detected when the mean value is only used.
I think Quadratic Entropy can quantify heterogeneity and may be useful for high content screening in drug discovery. Next, I will try to calculate and compare values of QE & other diviersity index (shannon's entropy & Simpson index).